Power Hungry
Member
Here are some more test results of testing with the WWG2. The test vehicle is as follows:
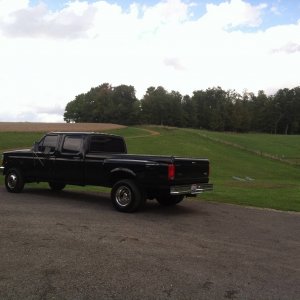
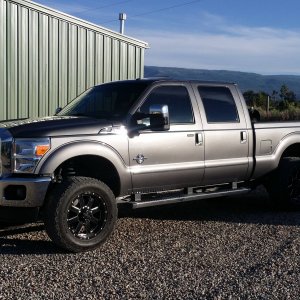
2003 F350 CC, Dually 4WD, VDH5 (TNAA7S3), 230K miles, Injectors and HPOP replaced 6 mos. ago. Otherwise, the truck is completely stock.
As usual, testing was with 8000 Lbs load on the dyno. All runs we competed in 3rd gear locked. Speed was held at a steady 1400 RPM until full throttle was applied. Data sampling was taken from 1500 RPM to 3500 RPM. All testing was achieved with engine and transmission at normal operating temperature with 70º ambient air temp. All runs were datalogged to obtain boost and backpressure readings, along with monitoring EOT, ICP, IPR, and other critical data. Unfortunately, this vehicle was not equipped with a pyrometer so we were not able to observe any changes in EGTs. Datalog pressures were verified with a mechanical boost gauge and are considered to be accurate with +/- 0.25 PSI.
Generated results are as follow:
Stock ECM calibration (minus Speed Limiter and Rev Limiter) - Stock wheel vs. WWG2
Boost:
Backpressure:
Dyno Graphs:
(Click on image to enlarge)

Overall Gains:
(Click on image to enlarge)

Standard PHP 40 Tow - Stock wheel vs. WWG2
Boost:
Backpressure:
Dyno Graphs:
(Click on image to enlarge)

Overall Gains:
(Click on image to enlarge)

Overall Gain - Stock ECM/Stock Wheel vs. PHP 40 Tow Calibration/WWG2
Dyno Graphs:
(Click on image to enlarge)

Overall Gains:
(Click on image to enlarge)

We will be testing another S/D vehicle later this week (Friday) and will post up those results as well as they become available.
2003 F350 CC, Dually 4WD, VDH5 (TNAA7S3), 230K miles, Injectors and HPOP replaced 6 mos. ago. Otherwise, the truck is completely stock.
As usual, testing was with 8000 Lbs load on the dyno. All runs we competed in 3rd gear locked. Speed was held at a steady 1400 RPM until full throttle was applied. Data sampling was taken from 1500 RPM to 3500 RPM. All testing was achieved with engine and transmission at normal operating temperature with 70º ambient air temp. All runs were datalogged to obtain boost and backpressure readings, along with monitoring EOT, ICP, IPR, and other critical data. Unfortunately, this vehicle was not equipped with a pyrometer so we were not able to observe any changes in EGTs. Datalog pressures were verified with a mechanical boost gauge and are considered to be accurate with +/- 0.25 PSI.
Generated results are as follow:
Stock ECM calibration (minus Speed Limiter and Rev Limiter) - Stock wheel vs. WWG2
Boost:
- Stock:
- 7.8 PSI @ 2000
- 14.3 PSI @ 2500
- 16.2 PSI @ 3500
- WWG2:
- 7.5 PSI @ 2000
- 14.7 PSI @ 2500
- 19.8 PSI @ 3500
Backpressure:
- Stock:
- 11.9 PSI @ 2000
- 23.9 PSI @ 2500
- 31.1 PSI @ 3500
- WWG2:
- 10.6 PSI @ 2000
- 23.3 PSI @ 2500
- 33.5 PSI @ 3500
Dyno Graphs:
(Click on image to enlarge)
Overall Gains:
(Click on image to enlarge)
Standard PHP 40 Tow - Stock wheel vs. WWG2
Boost:
- Stock:
- 8.6 PSI @ 2000
- 15.0 PSI @ 2500
- 18.5 PSI @ 3500
- WWG2:
- 7.8 PSI @ 2000
- 16.2 PSI @ 2500
- 23.8 PSI @ 3500
Backpressure:
- Stock:
- 13.4 PSI @ 2000
- 24.7 PSI @ 2500
- 35.5 PSI @ 3500
- WWG2:
- 10.2 PSI @ 2000
- 23.2 PSI @ 2500
- 37.4 PSI @ 3500
Dyno Graphs:
(Click on image to enlarge)
Overall Gains:
(Click on image to enlarge)
Overall Gain - Stock ECM/Stock Wheel vs. PHP 40 Tow Calibration/WWG2
Dyno Graphs:
(Click on image to enlarge)
Overall Gains:
(Click on image to enlarge)
We will be testing another S/D vehicle later this week (Friday) and will post up those results as well as they become available.


