Strictly Diesel
Active member
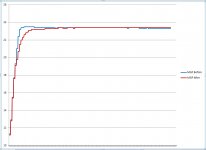
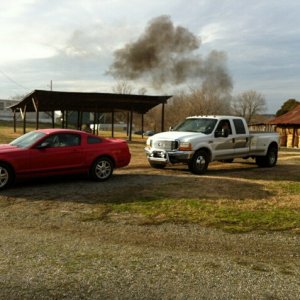
OK, before I get into this I have to point out that I had a total "senior moment" (another reminder of being "forty something") during my setup for this testing...and unfortunately it totally screwed up an important piece of the data I was trying to collect. What's worse...the problem stems from forgetting that my own truck was running a piece of my own equipment...something I've been building for years...so go ahead...call me a dumbass now and get it over with!
Yes...you guessed it...forgot to take the Mother F%$#ing overboost kit off the damn truck :doh: :doh: :doh: :doh: !!! Since most of the testing was being done under cruise control, towing a trailer, it just never occurred to me. My decision to make the WOT pulls came at the end of my "cruise" testing...as I got to the hill I thought "Hey..lets log a WOT pull up this hill with the trailer". Then I did it again during the "after" testing...still not thinking a thing about it...until I opened both logs, graphed them and spent about 30 seconds scratching my head and staring at a pair of graphs that flatlined perfectly at exactly the same pressure :doh: :doh: :doh: :doh:. What followed was gratuitous use of 4-letter words...the kind that make my daughter giggle and my wife leave the room.
Because I wanted my before/after testing to be as accurate and representative of the performance of the COMPRESSOR as possible, I even installed one of Bobs "TurboMaster" wastegate controllers prior to the testing. Since the TM operates strictly on EBP (no boost pressure applied to a diaphragm), I felt that what we "should" see is the results of a wastegate that was opening at the same backpressure in both cases. I also personally did the removal and installation of the compressor housing and wastegate actuator during the swap, to make sure that the adjustment was not touched.
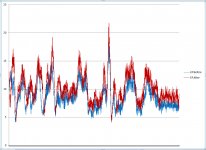
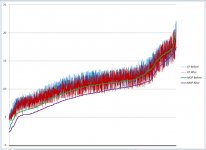
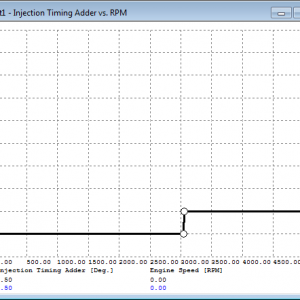
So now I will present you with the data I did collect. To be perfectly honest, I'm at a loss with regard to my interpretation of the data. Each graph (except the WOT ones) represents about 8 miles of driving (about 14,500-15,000 data points per line) at 72mph with about 10k# of trailer behind me. Leg 1 and Leg 2 are essentially the same drive, just the opposite direction. I did have to chop some data points off the front and back ends of the graphs to get the "hills and valleys" to line up in the before and after graphs.
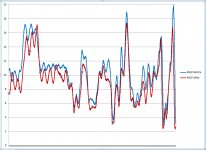
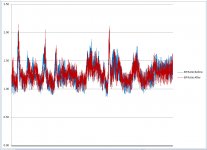
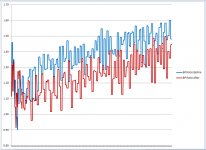
I will break my posts up by reading (MGP, EBP and Boost/EBP Ratio)...lets start with Manifold Gauge Pressure:
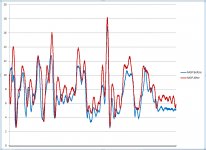
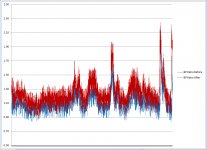
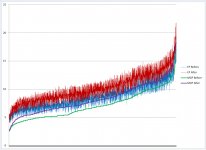
In ALL graphs, BLUE = Before (stock wheel) and RED = After (WW2)
I find it interesting that during leg 1, the stock wheel made more boost...and during leg 2 (same road, opposite direction), the WW made more boost. The only factor that I can't account for here is the possibility of a tail/head wind that may have affected the load on the truck...and the subsequent boost readings. I'm pretty disappointed with the fact that both legs are not showing consistent data (one wheel out-performing the other)...tells me something out of my control was affecting things.
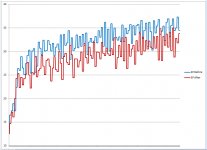
I posted the 3rd (WOT) graph just so you can ointlaugh:
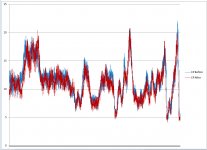
Next up...EBP graphs...
Yes...you guessed it...forgot to take the Mother F%$#ing overboost kit off the damn truck :doh: :doh: :doh: :doh: !!! Since most of the testing was being done under cruise control, towing a trailer, it just never occurred to me. My decision to make the WOT pulls came at the end of my "cruise" testing...as I got to the hill I thought "Hey..lets log a WOT pull up this hill with the trailer". Then I did it again during the "after" testing...still not thinking a thing about it...until I opened both logs, graphed them and spent about 30 seconds scratching my head and staring at a pair of graphs that flatlined perfectly at exactly the same pressure :doh: :doh: :doh: :doh:. What followed was gratuitous use of 4-letter words...the kind that make my daughter giggle and my wife leave the room.
Because I wanted my before/after testing to be as accurate and representative of the performance of the COMPRESSOR as possible, I even installed one of Bobs "TurboMaster" wastegate controllers prior to the testing. Since the TM operates strictly on EBP (no boost pressure applied to a diaphragm), I felt that what we "should" see is the results of a wastegate that was opening at the same backpressure in both cases. I also personally did the removal and installation of the compressor housing and wastegate actuator during the swap, to make sure that the adjustment was not touched.
So now I will present you with the data I did collect. To be perfectly honest, I'm at a loss with regard to my interpretation of the data. Each graph (except the WOT ones) represents about 8 miles of driving (about 14,500-15,000 data points per line) at 72mph with about 10k# of trailer behind me. Leg 1 and Leg 2 are essentially the same drive, just the opposite direction. I did have to chop some data points off the front and back ends of the graphs to get the "hills and valleys" to line up in the before and after graphs.
I will break my posts up by reading (MGP, EBP and Boost/EBP Ratio)...lets start with Manifold Gauge Pressure:
In ALL graphs, BLUE = Before (stock wheel) and RED = After (WW2)
I find it interesting that during leg 1, the stock wheel made more boost...and during leg 2 (same road, opposite direction), the WW made more boost. The only factor that I can't account for here is the possibility of a tail/head wind that may have affected the load on the truck...and the subsequent boost readings. I'm pretty disappointed with the fact that both legs are not showing consistent data (one wheel out-performing the other)...tells me something out of my control was affecting things.
I posted the 3rd (WOT) graph just so you can
ointlaugh:Next up...EBP graphs...